Monitoring GUIs
Each device exposes a list of monitoring points as attributes with the _R prefix. These can be accessed interactively from a controle console (such as Jupyter), but that will not scale.
Grafana
We offer Grafana dashboards on http://localhost:3000 that provide a quick overview of the station’s status, including temperatures and settings. Several dashboards are included. An example:
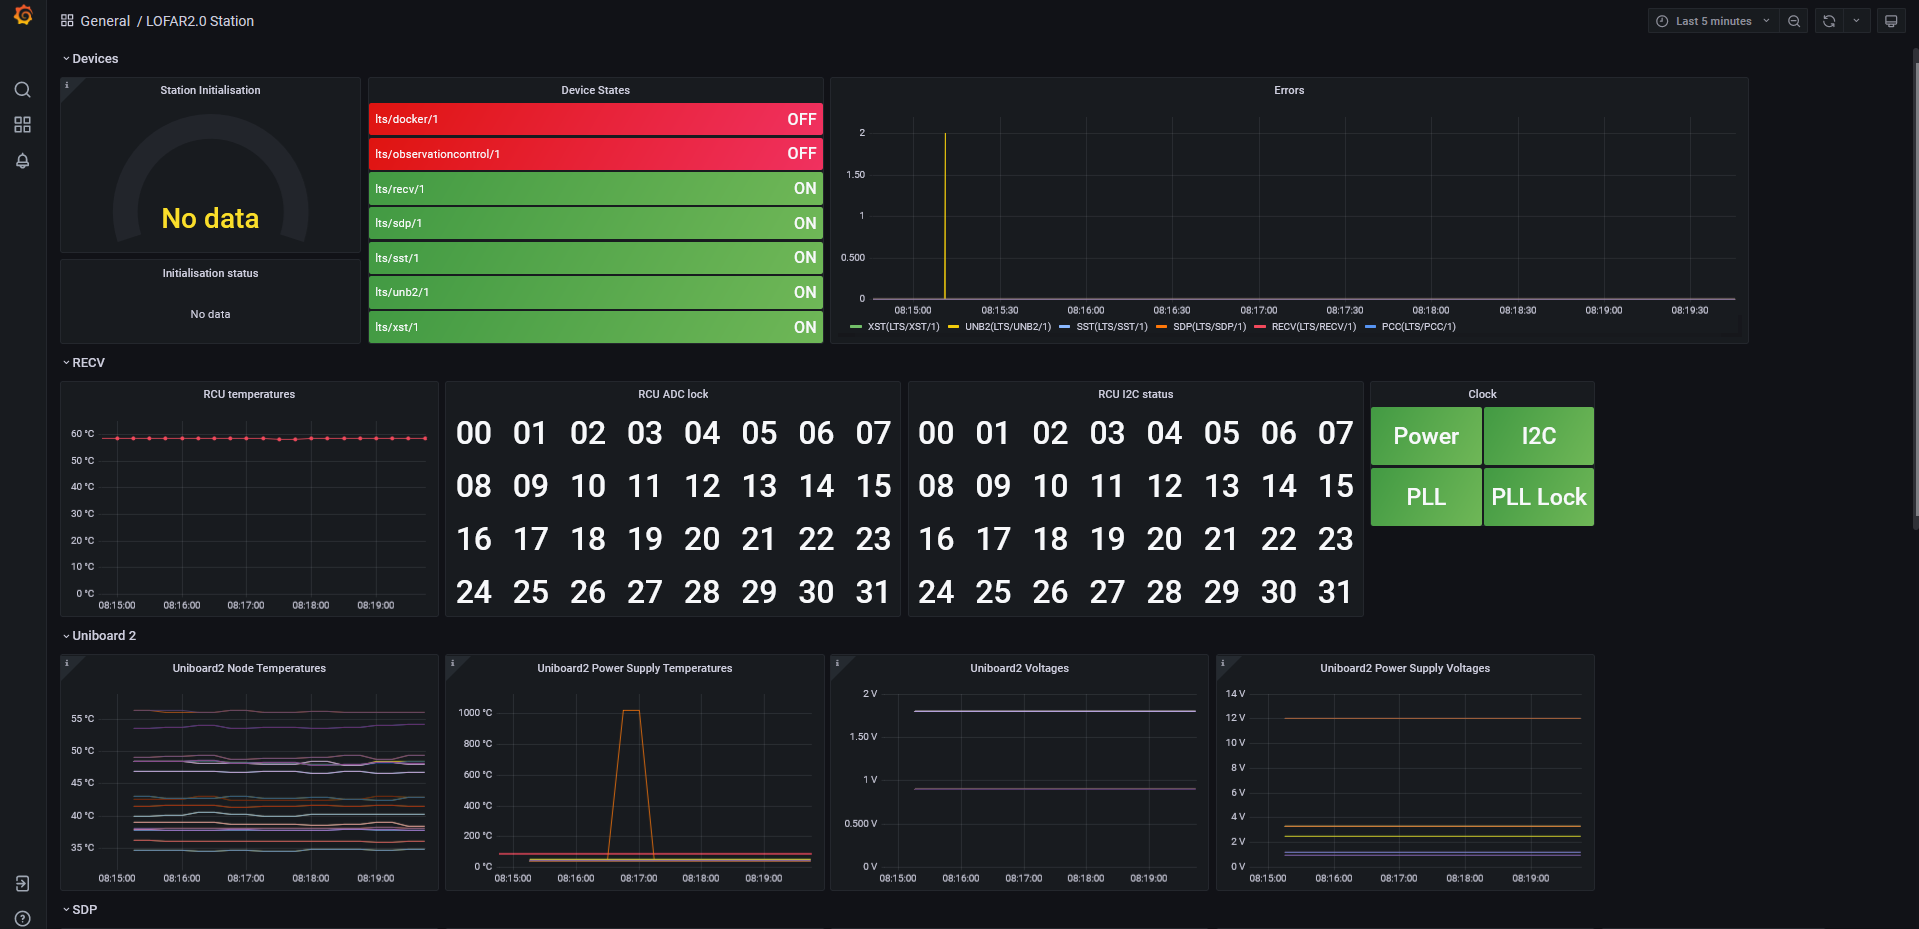
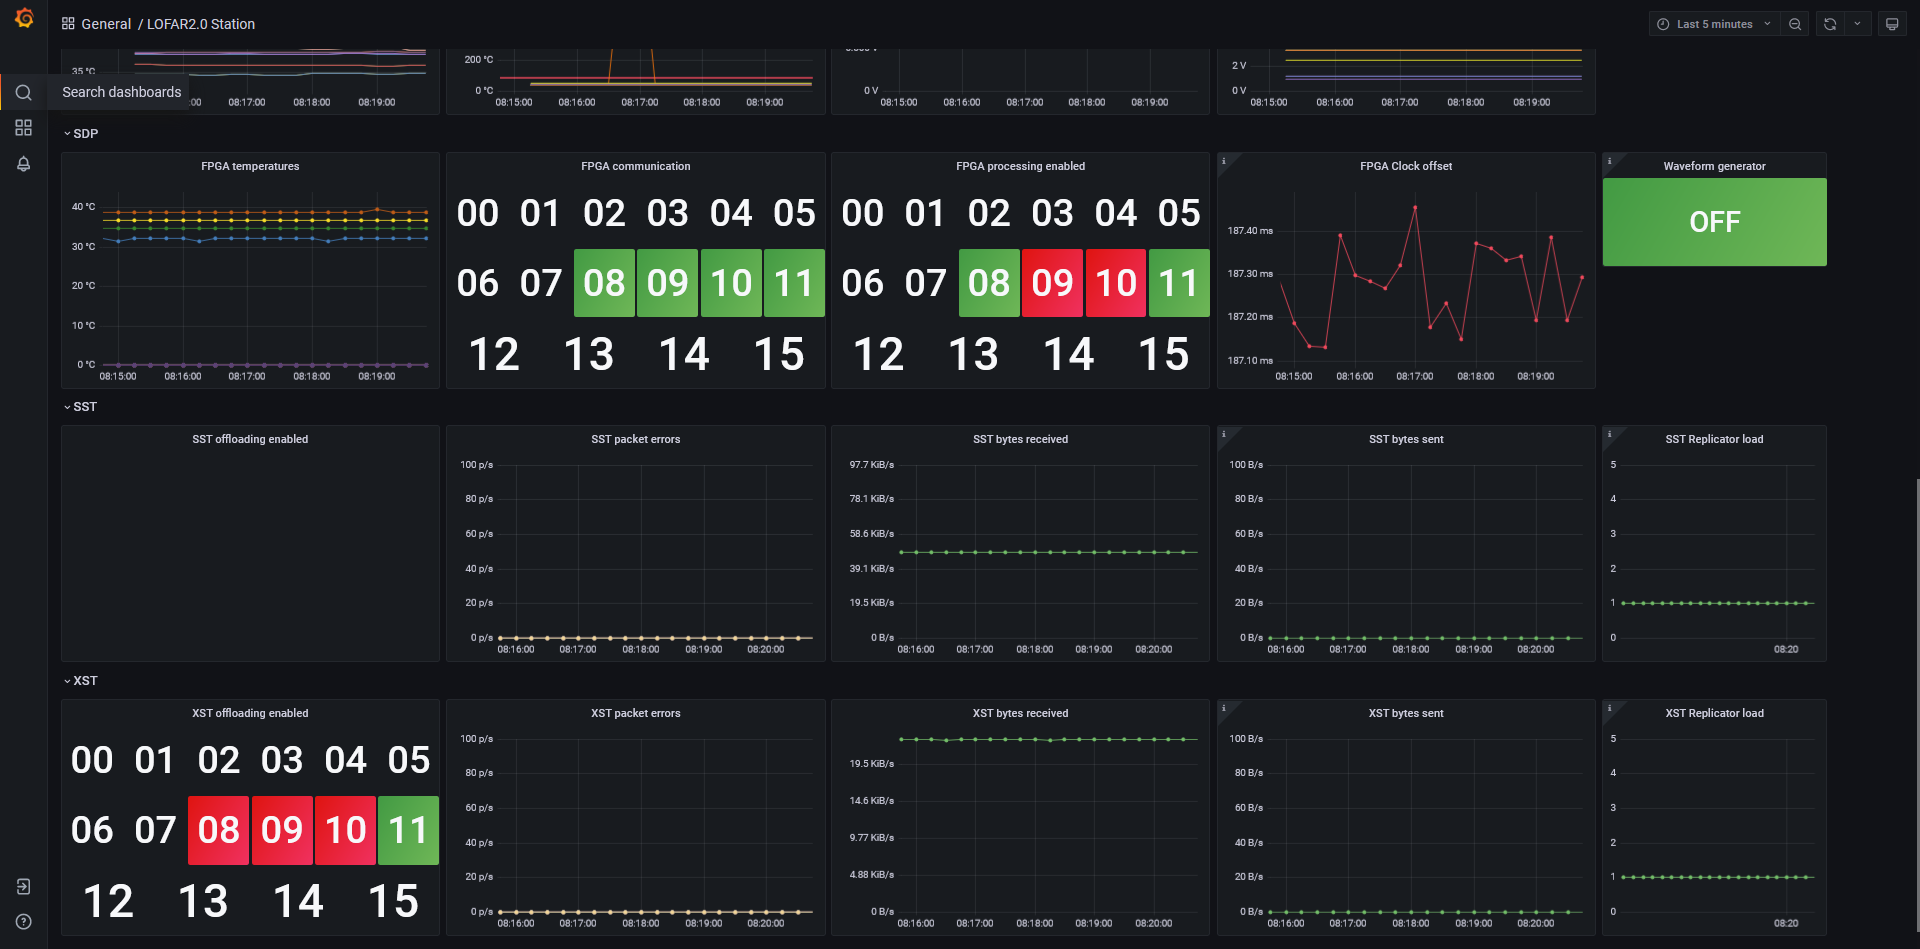
NOTE: These dashboards are highly subject to change. The above examples provide an impression of a possible overview of the station state.
You are encouraged to inspect each panel (graph) to see the underlying database query and settings. Use the small arrow in the panel’s title to get a drop-down menu of options, and select inspect. See the Grafana documentation for further information.
The Grafana dashboards are configured with the following data sources:
Prometheus, the time-series database that caches the latest values of all monitoring points (see next section),
TangoDB, providing access to device properties (fixed settings),
Loki, the log output of the devices.
Prometheus
Prometheus is a low-level monitoring system that allows us to periodically retrieve the values of all the attributes of all our devices, and cache them to be used in Grafana:
Every several seconds, Prometheus scrapes our TANGO-Grafana Exporter (our fork of https://gitlab.com/ska-telescope/TANGO-grafana.git), collecting all values of all the device attributes (except the large ones, for performance reasons).
Prometheus can be queried directly on http://localhost:9090,
The TANGO-Grafana Exporter can be queried directly on http://localhost:8000,
The query language is PromQL, which is also used in Grafana to query Prometheus,
Prometheus stores attributes in the following format:
device_attribute{device="stat/recvh/1",
                 dim_x="32", dim_y="0",
                 instance="tango-prometheus-exporter:8000",
                 job="tango",
                 label="RCU_temperature_R",
                 name="RCU_temperature_R",
                 type="float",
                 x="00", y="0"}
The above describes a single data point and its labels. The primary identifying labels are device and name. Each point furthermore has a value (integer) and a timestamp. The following transformations take place:
For 1D and 2D attributes, each array element is its own monitoring point, with
xandylabels describing the indices. The labelsdim_xanddim_ydescribe the array dimensionality,Attributes with string values get a
str_valuelabel describing their value.