Logs
The devices, and the docker containers in general, produce logging output. The easiest way to access the logs of a specific container is to ask docker directly. For example, to access and follow the most recent logs of the device-sdp container, execute on the host:
docker logs -n 100 -f device-sdp
This is mostly useful for interactive use.
Loki
To monitor the logs remotely, or to browse older logs, use the Logs Dashboard that is included among the Grafana dashboards, and served on http://localhost:3000/d/Hqo-qIO4z/logs?orgId=1. Loki is a log aggregation system fully integrated in Grafana and inspired by Prometheus. Currently, the following logs are collected in our Grafana Loki implementation:
Logs of all devices,
Logs of the Docker containers.
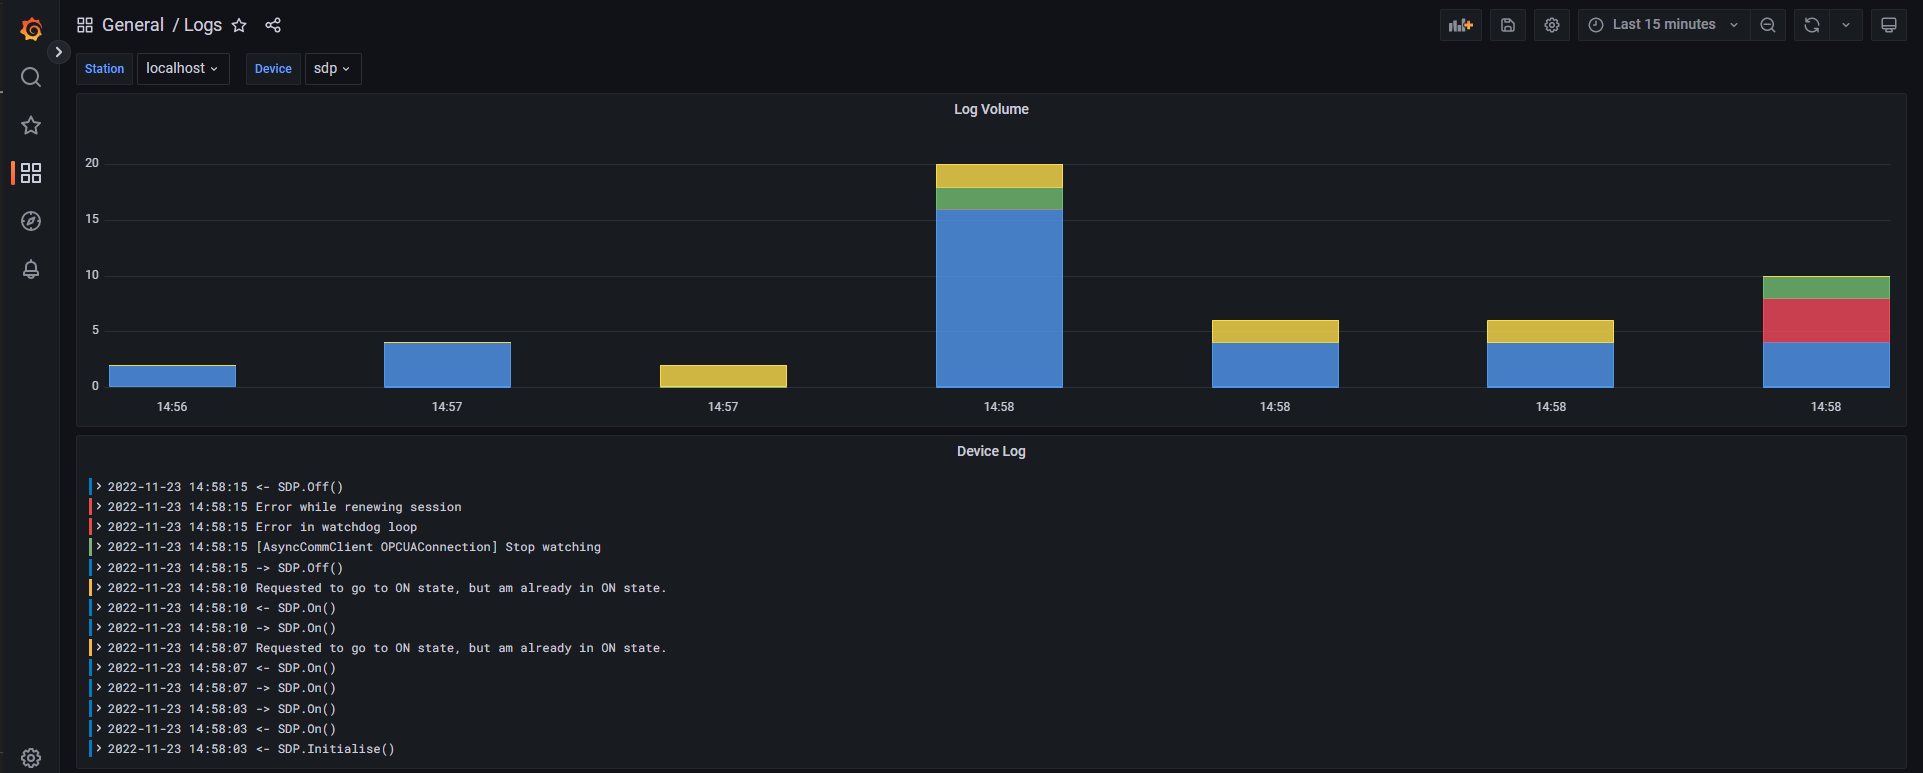
Once reached the Grafana Logs Dashboard, it is possible to select several parameters such as station name, device name and interval to perform the log research. Logs will be marked with different colors, following their level (e.g. INFO, WARNING, ERROR, etc.).
You should see something like: